21 Chapter 2: Forms and reports
Michael Hrycay and Aydrian Hayes
Lesson 1: Navigating Relevant Documentation (Week 1)
Learning Objectives
- Interpret, scan, use and fill out relevant documents.
Professional Forms and Documentation
In the professional workplace, individuals frequently encounter a variety of relevant documents pivotal to their job functions. These documents vary widely, from contracts, reports, and manuals to forms, memos, and technical specifications. The ability to accurately interpret, scan, and utilize these documents is crucial for multiple reasons. Firstly, they often contain essential information that informs decision-making and day-to-day operations. Proper interpretation ensures tasks are executed accurately and in compliance with standards or guidelines. Furthermore, many of these documents require inputs; thus, the capacity to correctly fill them out is essential to ensure consistency, legality, and clarity in business processes. In essence, mastery in handling and understanding relevant documents enhances efficiency, minimizes errors, and sustains the smooth operation of any professional environment. Some examples include:
- Log Books: Used in numerous fields to record activities, observations, or events chronologically. Examples include maintenance logs in engineering, patient logs in healthcare, or flight logs in aviation.
- Contracts: Legally binding agreements detailing the rights and obligations of parties involved. This can range from employment contracts to vendor agreements.
- Reports: Can be financial reports, research reports, project status updates, or annual reports that provide detailed information on a specific topic or period.
- Manuals: Instruction guides or reference books that detail procedures or specifications. Examples include user manuals for equipment or SOP (Standard Operating Procedure) manuals for various processes.
- Forms: Structured documents used for collecting specific information. Examples are HR forms (like leave or reimbursement forms), customer feedback forms, or order forms.
- Memos: Internal documents sent within organizations to convey announcements, updates, or specific requests.
- Technical Specifications: Detailed documents providing technical details about a product, process, or service, often used in industries like IT, construction, or manufacturing.
- Minutes of Meetings: Written records of everything discussed during a meeting.
- Invoices: Itemized billings for goods sold or services provided, detailing amounts owed.
- Purchase Orders: Documents issued by a buyer to a seller, indicating types, quantities, and agreed prices for products or services.
- Safety Protocols: Guidelines and checklists used, especially in industries where safety is paramount, such as construction, chemicals, or heavy machinery.
- Training Materials: Handouts, presentations, or guides used in the training of staff or introduction of new procedures.
- Policies and Guidelines: Documents detailing the rules, ethics, and framework of how things are done in an organization.
Logbooks
For many professionals, logbooks are a vital tool. They help in recording essential information, aiding in troubleshooting and referencing specific project details. While these logs fulfill regulatory requirements, they also document one’s work. Using notebooks or loose papers might seem convenient, but they can be misplaced. As you grasp the significance of logbooks, they’ll soon become an indispensable part of your daily routine.
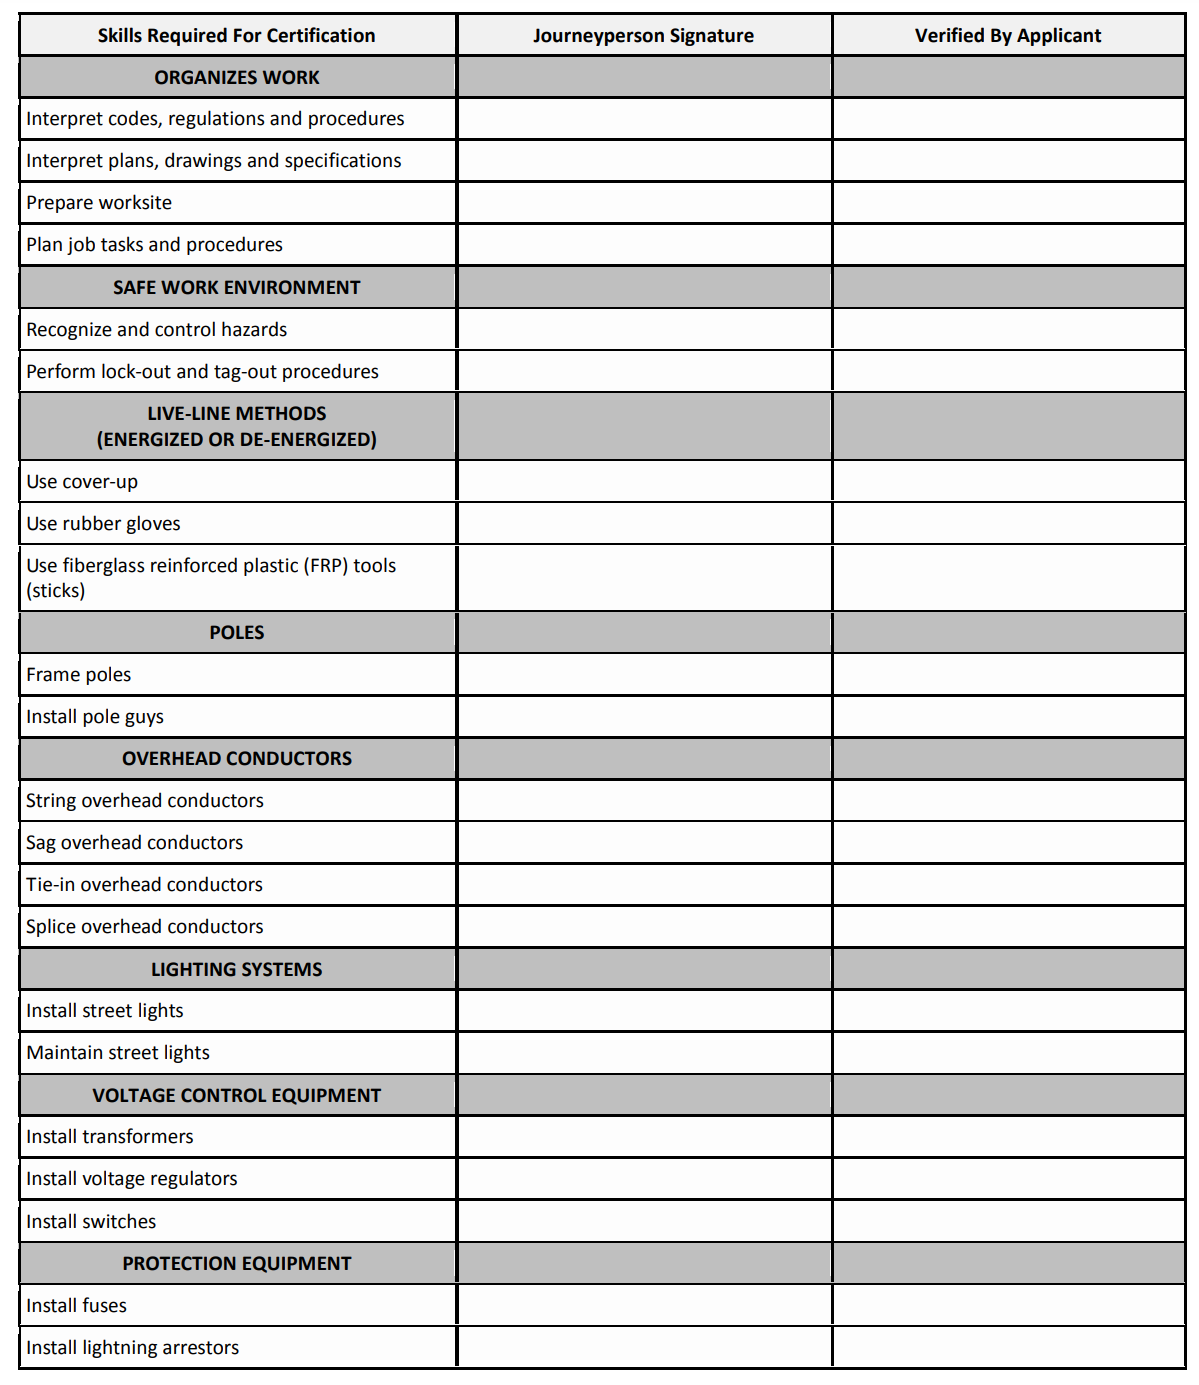
Apprenticeship Training Logbooks
In many trades and professions, apprenticeship is a structured method of training where an apprentice learns directly from an experienced professional. This approach is a combination of on-the-job training and, often, classroom instruction. The process ensures that the apprentice acquires hands-on experience while grasping the theoretical aspects of the trade or profession. Upon starting an apprenticeship, apprentices are provided with a training logbook that outlines the essential skills and work methods needed for their progression. As they demonstrate proficiency in each skill, their mentor will initial and date the corresponding section of the logbook. This logbook acts as both a guide to the skills they need to acquire and an official record of their accomplishments. Therefore, it’s imperative for them to always have it on hand and safeguard it.
Training Logbook Sample
Inspection logbooks
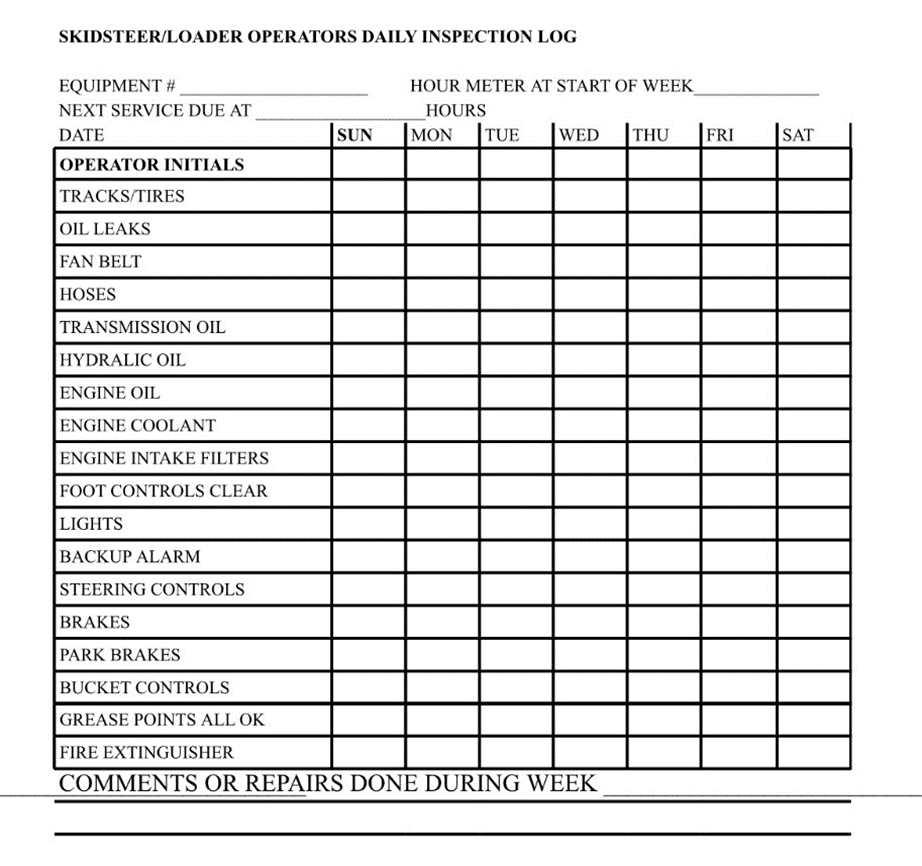
Inspections are relatively simple tasks where you use a voltmeter or other device to test the safety and functionality of a building’s electrical system. Inspections are important because they help make sure that you can provide customers with a safe, efficient system when it comes time for them to use the wiring you installed.
Inspection logs usually contain information about what kind of inspection was performed on an equipment, where it was performed and what parts of the system were inspected. Most technicians also provide a little bit of information about their findings and the causes for any problems that needed to be addressed.
Inspection Logbook Example
Reading and Interpretation of Relevant Documents
In today’s fast-paced professional environment, the ability to read efficiently is invaluable. Given the volume of information one encounters daily, mastering specific reading techniques can significantly enhance comprehension and time management. Here are three tried-and-true techniques:
1. Key Words and Phrases: This technique revolves around focusing on specific words or phrases that capture the main idea or core message of the content. Before diving into a document, try to predict which words or phrases will be pivotal based on the topic or context. As you navigate the material, these key terms can act as markers, guiding you to the most crucial sections. By emphasizing these words or phrases, you facilitate faster comprehension, allowing you to swiftly discern the text’s primary message while filtering out less relevant details. It’s a tactic that enables readers to quickly digest and recap information, especially in dense or complex documents.
2. Scanning: Scanning is the art of swiftly reviewing a text to gain a broad understanding without immersing oneself in every detail. It’s particularly useful when you’re trying to get a general sense of a document’s content or when searching for specific information. Begin by observing headings and subheadings, which often provide insights into the content’s structure. The first and last sentences of paragraphs are also revealing, often summarizing the main points. Additionally, any bolded, italicized, or underlined text usually indicates critical information, making them worth a closer look.
3. Skimming: Similar to scanning but with a slightly different focus, skimming involves reading a text quickly to understand its overarching ideas. Instead of hunting for specifics, as in scanning, skimming provides a birds-eye view of the content. The introduction or summary of a piece can offer valuable insights, and the first and last paragraphs often encapsulate the primary themes. While gliding through the material, it’s helpful to note recurring concepts or terms, as they indicate areas of emphasis.
Reading Charts and Graphs
A picture, so they say, will tell a thousand words. But what about a graph or chart? A good graph or chart can show as many as several paragraphs of words. But how do you choose which style of graph to use?
This page sets out some of the basics behind drawing and creating good graphs and charts. By ‘good’, we mean ones that show what you want them to show, and don’t mislead the reader.
Types of Charts
There are several different types of charts and graphs. The four most common are probably line graphs, bar graphs and histograms, pie charts, and Cartesian graphs. They are generally used for and are best for, quite different things. You would use:
- Bar graphs to show numbers that are independent of each other. Example data might include things like the number of people who preferred each of Chinese takeaways, Indian takeaways and fish and chips.
- Pie charts to show you how a whole is divided into different parts. You might, for example, want to show how a budget had been spent on different items in a particular year.
- Line graphs show you how numbers have changed over time. They are used when you have data that are connected, and to show trends, for example, average night-time temperature in each month of the year.
- Cartesian graphs have numbers on both axes, which therefore allow you to show how changes in one thing affect another. These are widely used in mathematics, and particularly in algebra.Axes: Graphs feature two axes: the x-axis (horizontal) running across the bottom and the y-axis (vertical) along the side. The x-axis may show categories or numbers, while the y-axis typically displays numbers. Both usually start from the bottom left, and their labels indicate the data type. Be cautious if the y-axis doesn’t begin at 0; this can be misleading.
Axes: Graphs feature two axes: the x-axis (horizontal) running across the bottom and the y-axis (vertical) along the side. The x-axis may show categories or numbers, while the y-axis typically displays numbers. Both usually start from the bottom left, and their labels indicate the data type. Be cautious if the y-axis doesn’t begin at 0; this can be misleading.
Bar Graphs and Histograms: Bar graphs often display categories on the x-axis and numbers on the y-axis. This allows the comparison of numbers across distinct categories, which should be independent of each other.
Bar Graph and Histogram
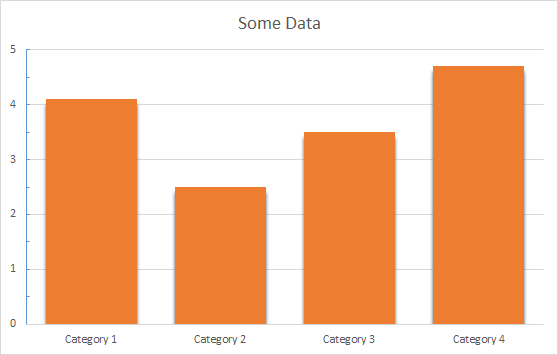
You can see immediately that this graph gives you a clear picture of which category is largest and which is smallest. It gives a clear comparison between categories. You can also use the graph to read information about how many are in each category without having to refer to the data table, which may or may not be provided with every graph you see. In general, you can draw bar graphs with the bars either horizontal or vertical, because it doesn’t make any difference. The bars do not touch.
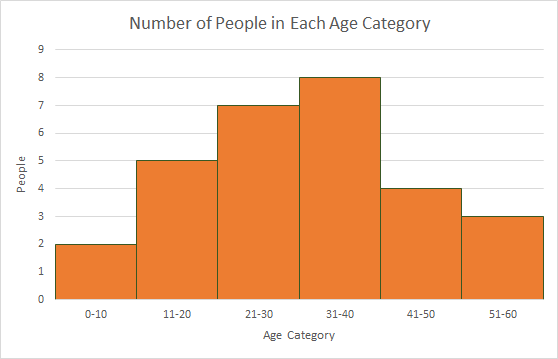
A histogram is a specific type of bar chart, where the categories are ranges of numbers. Histograms, therefore, show combined continuous data.
Example:
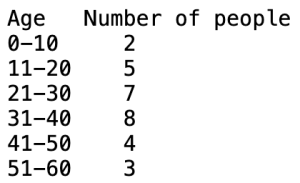
You have been given a list of ages in years, and you need to show them in a graph. The ages are:5, 12, 23, 22, 28, 17, 11, 21, 25, 23, 7, 16, 13, 39, 35, 42, 24, 31, 35, 36, 35, 34, 37, 44, 51, 53, 46, 45, and 57. You can choose to group them into ten-year age categories, 0–10, 11–20, 21–30 and so on:
Age Number of people
0-102
11-205
21-307
31-408
41-504
51-603
To show this data in a histogram, your x-axis would be numbered in 10s from 0 to your highest age, your y-axis from 0 to 8 (the highest number of people in any group), and there would be no gaps between the bars because there are no gaps between the age ranges.
Learning Task
Graph Interpretation (5 minutes)
Instructions:
Consider the given data about people’s ages:
Answer the following:
- Which age range has the most number of people?
- If you were to create a histogram from the data, which age range would have the tallest bar?
- Based on the description provided, would there be gaps between the bars on the histogram? Why or why not?
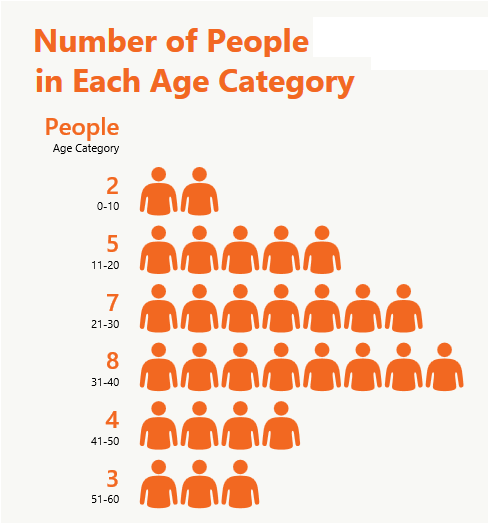
Pictograms
A pictogram is a special type of bar graph. Instead of using an axis with numbers, it uses pictures to represent a particular number of items. For example, you could use a pictogram for the data above about ages, with an image of a person to show the number of people in each category:
Pie Charts
A pie chart looks like a circle (or a pie) cut up into segments. Pie charts are used to show how the whole breaks down into parts. For example, this data shows the sales figures for a year, broken down by quarters:
Quarterly Sales Figures:
1st Qtr8.2
2nd Qtr3.2
3rd Qtr1.4
4th Qtr1.2
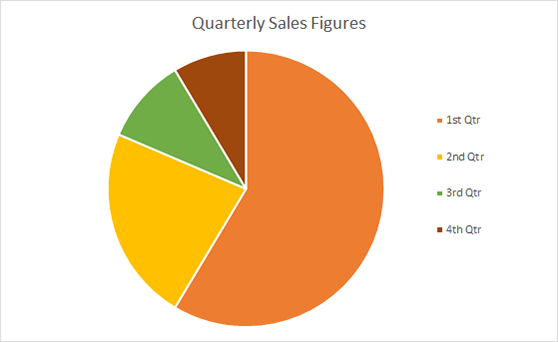
The pie chart illustrates that sales in Quarter 1 significantly surpassed other quarters, accounting for over 50% of annual sales, with Quarter 2 following at around 25%. Without additional context, the chart suggests a concerning decline in sales throughout the year. Pie charts depict dependent data, ensuring total sales in a year are distributed among the quarters; if one quarter’s sales are adjusted, another must be modified accordingly, assuming the annual total is accurate. Essentially, pie charts represent percentages of a whole, with each segment sized to match its share of the 100% total. It’s generally inadvisable to use pie charts for more than 5 or 6 categories due to visualization challenges; in such cases, alternative charts might be more effective.
Line Graphs
Line graphs are usually used to show dependent data, particularly trends over time. Line graphs depict a point value for each category, which is joined in a line. We can use the data from the pie chart as a line graph too.
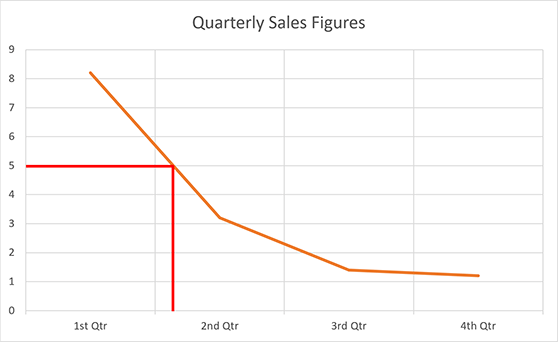
You can see even more obviously that sales have fallen rapidly over the year, although the slow down is levelling out at the end of the year. Line graphs are particularly useful for identifying the point in time at which a certain level of sales, revenue (or whatever the y value represents) was reached.
In the example above, suppose we want to know during which quarter sales first fell below 5. We can draw a line across from 5 on the y-axis (red line on the example) and see that it was during quarter 2.
Cartesian Graphs
Cartesian graphs are what mathematicians really mean when they talk about graphs. They compare two sets of numbers, one of which is plotted on the x-axis and one on the y-axis. The numbers can be written as Cartesian coordinates, which look like (x,y), where x is the number read from the x-axis, and y the number from the y-axis.
Warning– Cartesian graphs do not always start at 0; quite often (0,0) is the mid-point of the graph.
Cartesian Graph – Worked Example
John is two years older than Mary, and their ages added together equal 12. What age are they both now?
We can solve this by drawing two lines, one of John’s age compared with Mary’s, and one of the ages that add together to give 12.
Line 1: John’s (actual) age when Mary is different ages between 1 and 9
|
Mary’s Age
|
John’s Age (=Mary + 2)
|
|
1 |
3 |
|
2 |
4 |
|
3 |
5 |
|
4 |
6 |
|
5 |
7 |
|
6 |
8 |
|
7 |
9 |
|
8 |
10 |
|
9 |
11 |
Line 2: John’s (hypothetical) age when Mary is different ages between 1 and 9 if their ages add up to 12
|
Mary’s Age
|
John’s Age (=12 – Mary’s Age) |
|
1 |
11 |
|
2 |
10 |
|
3 |
9 |
|
4 |
8 |
|
5 |
7 |
|
6 |
6 |
|
7 |
5 |
|
8 |
4 |
|
9 |
3 |
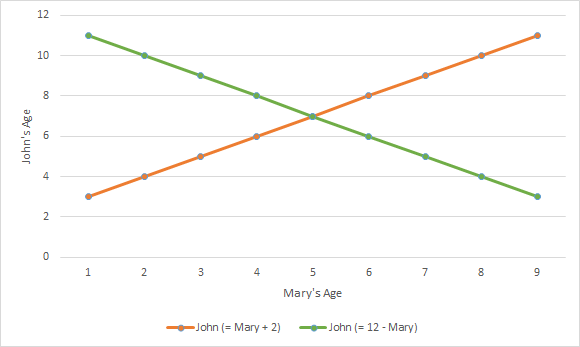
Plotting the two lines on graph, with Mary’s age as the x-axis, you can see that there is a point at which the lines cross. This is the only point at which a) John is two years older than Mary and b) their ages add up to 12. This must be their current ages, which are therefore 5 for Mary and 7 for John.
Drawing Graphs using Computer Packages
You can use various computer software packages, including Word and Excel, to draw graphs.
Some packages are extremely capable when used effectively. However, be aware that some applications are rather limited in the type of charts that they can draw, and you may not find the results entirely what you expected! You really need a basic understanding of graphs and charts so that you can compare what the computer has created to what you want to show.
Computer applications also make it easy to produce overly complicated graphs. A 3D exploding pie chart may look ‘cool’ but does it help you or others to visualize the data? It is often best to keep graphs and charts simple with neat, clear formatting.
Journal Question – Class Discussion
Reflect on your response for the prompt below in relation to effective communication. Share your insights on interpreting and using documents and how this can affect communication and professional success. Share your reflections with the class and engage in a class discussion.
Prompt: How do you approach interpreting and using relevant documents in your work or studies?
Criteria |
Exemplary (4)
|
Accomplished (3)
|
Developing (2)
|
Beginning (1)
|
Purpose |
Strong voice and tone that clearly addresses the purpose for writing. | Appropriate voice and tone. The purpose is largely clear. | Attempts to use personal voice and tone. Somewhat addresses the intended purpose. | Demonstrates limited awareness of use of voice and tone. Limited evidence of intended purpose. |
Understanding |
Many interesting, specific facts and ideas are included. | Many facts and ideas are included. | Some facts and ideas are included. | Few facts and ideas are included. |
Conventions |
All grammar and spelling is correct. | Only one or two grammar and spelling errors. | A few grammar and spelling errors. | Many grammar and spelling errors. |
Reply |
Made two significant contributions to the class discussion. Highly supportive of others. | Made one contribution to the class discussion. Supported group members. | Attempted to contribute to the class discussion but was vague and unclear in the contribution. | Minimally involved. Offered limited support to classmates. |
Lesson 2: Reporting Policies and Procedures (Week 2)
Learning Objectives
- Understand and apply reporting policies for hazards, injuries, and environmental impacts
- Identify the steps for job hazard analysis
Hazard Reports
Hazard Assessments
A hazard is an activity, situation or substance that could cause harm. Risk is the chance that a hazard will cause harm. Hazard assessment is the process of identifying workplace hazards (both existing and potential), assessing the risk, implementing controls and reviewing to ensure hazards are eliminated or the risk minimized.
Hazard assessment is a proactive activity to improve health and safety. By identifying hazards and implementing controls, the workplace can prevent injuries and illnesses and the associated costs (both human and financial). Hazard assessment is an important foundation for other elements of a health and safety system, such as inspections, training, practices and procedures.
There are many methods to identify hazards. An important method is a job hazard analysis (JHA). JHA is the process of systematically evaluating a job, task, process or procedure to identify hazards and their associated risks, and then eliminating or reducing the risks to be as low as reasonably possible in order to protect workers from injury. Job hazard analysis is sometimes called job safety analysis or job task analysis. JHAs can be done through discussion and observation (for example: using photos and videos).
Other methods to identify hazards include formal and informal hazard and risk assessment processes, inspections, field-level risk assessments, hazard and risk assessments related to emergency procedures, and procurement hazard and risk assessments.
It is very important to involve workers, especially those with experience when conducting hazard assessments.
An employer should:
- Define hazard reporting processes
- Conduct hazard assessments
- Assess the risk of the identified hazards using a risk assessment methodology
- Implement controls to address identified hazards, focusing on hazards with the greatest risk first, considering:
- hierarchy of controls:
- elimination/substitution, engineering, administrative (including safe work practices/procedures and training), personal protective equipment (PPE) at the source, along the path, at the worker level regulatory and other established standards
- Follow up on hazard controls to ensure they:
-
- have been implemented as intended
- are effective; and
- have not created new hazards.
- Maintain records of completed hazard assessments
Steps to Perform a Job Hazard Analysis:
- Inventory Occupations: Begin by listing all the occupations or roles within the organization or specific area you’re analyzing.
- List Tasks for Each Occupation: For every job role inventoried, enumerate all the tasks associated with it.
- Task Selection and Prioritization: Not all tasks are created equal. Decide which ones need immediate attention based on:
- Risk: Which tasks pose the greatest threat to safety?
- Newly Established Tasks: Prioritize tasks that are new and might not have undergone previous evaluations.
- Modified Tasks: Any task that has been changed or adjusted recently.
- Infrequently Performed Tasks: Tasks that are performed sporadically and may be unfamiliar to employees.
- Break Down Tasks: Dissect each task into its fundamental steps to fully understand its nature and potential risks.
- Identify Hazards: For every basic step outlined in the previous stage, recognize all the potential hazards that may be present.
- Assess Initial Risk: Evaluate the level of risk associated with each hazard, considering factors like likelihood, severity, and potential consequences.
- Determine Controls: For each identified hazard, establish appropriate controls or measures to mitigate the risk.
- Implement Controls: Put the determined safety measures into action.
- Reassess the Risk: After implementing controls, re-evaluate the risk to ensure that the measures have effectively reduced it to an acceptable level.
- Communication: Inform all relevant personnel about the findings of the hazard analysis and the safety measures put in place.
- Provide Training: Offer training to ensure that employees understand and can effectively follow the implemented controls.
Stop and Reflect
Think to yourself and/or discuss the concepts below with family and friends:
- Considering the steps outlined for performing a Job Hazard Analysis, reflect on a specific task or role within your workplace. Have all potential risks been adequately addressed, and are there areas where the process could be further refined to ensure a safer work environment?
What are examples of a hazard?
Workplace hazards can come from a wide range of sources. General examples include any substance, material, process, practice, etc. that has the ability to cause harm or adverse health effect to a person or property. See Table 1.
|
Table 1: Examples of Hazards and Their Effects |
||
|
Workplace Hazard |
Example of Hazard |
Example of Harm Caused |
|
Thing |
Knife |
Cut |
|
Substance |
Benzene |
Leukemia |
|
Material |
Mycobacterium tuberculosis |
Tuberculosis |
|
Source of Energy |
Electricity |
Shock, electrocution |
|
Condition |
Wet floor |
Slips, falls |
|
Process |
Welding |
Metal fume fever |
|
Practice |
Hard rock mining |
Silicosis |
|
Behaviour |
Bullying |
Anxiety, fear, depression |
Workplace hazards also include practices or conditions that release uncontrolled energy like:
- an object that could fall from a height (potential or gravitational energy),
- a run-away chemical reaction (chemical energy),
- the release of compressed gas or steam (pressure, high temperature),
- entanglement of hair or clothing in rotating equipment (kinetic energy), or
- contact with electrodes of a battery or capacitor (electrical energy).
|
HAZARD/CONCERN REPORT |
|||||
|
Location: |
|||||
|
PART 1 TO BE FILLED OUT BY THE WORKER |
|||||
|
Reported to: |
Date Reported: |
||||
|
Description of hazard/concern: Describe in detail and be specific (e.g., ice on front sidewalks, security procedures not followed after school hours, broken ladder in classroom 292). Use an additional sheet of paper if required. |
|||||
|
Corrective action taken: Describe what has been done already to eliminate this hazard or reduce the associated risk, by whom and date. |
|||||
|
Residual risk rating: See next page for matrix |
|||||
|
Solutions/corrective actions recommended: Describe in detail your ideas on how to eliminate this hazard or reduce associated risk. Use an additional sheet of paper if required. |
|||||
|
Part 1 Completed by: |
|||||
|
Name, Title and Phone Number (Please Print) |
Date |
Signature |
|||
|
|
|
|
|||
|
PART 2 TO BE FILLED OUT BY THE SUPERVISOR |
|||||
|
Corrective Actions Identified |
|||||
|
Corrective action/Control to be implemented |
Degree of risk |
Completion Target Date (YY/MM/DD) |
Date Completed (YY/MM/DD) |
Verified by (Signature) |
|
|
|
|
|
|
|
|
|
|
|
|
|
|
|
|
Part 2 Completed by: |
|||||
|
Name & Title (Please Print) |
Date |
Signature |
|||
|
|
|
|
|||
Stop and Reflect
For each hazard, determine the frequency of the hazard. Next, consider the potential consequence if something occurs. Using the risk matrix, determine the specific risk value (i.e., high, medium or low) of each hazard. Consider all factors that contribute to the degree of risk for each hazard presented to each group of workers. Consider the following factors to determine the likelihood and potential consequences:
- How often is the task performed: multiple times a day, daily, once a week or once a year? The more frequent a task is performed the greater the likelihood or chance there is for something to go wrong.
- If something did go wrong, how severe could the consequences be? Would the incident result in only minor injury or could it result in a fatality?
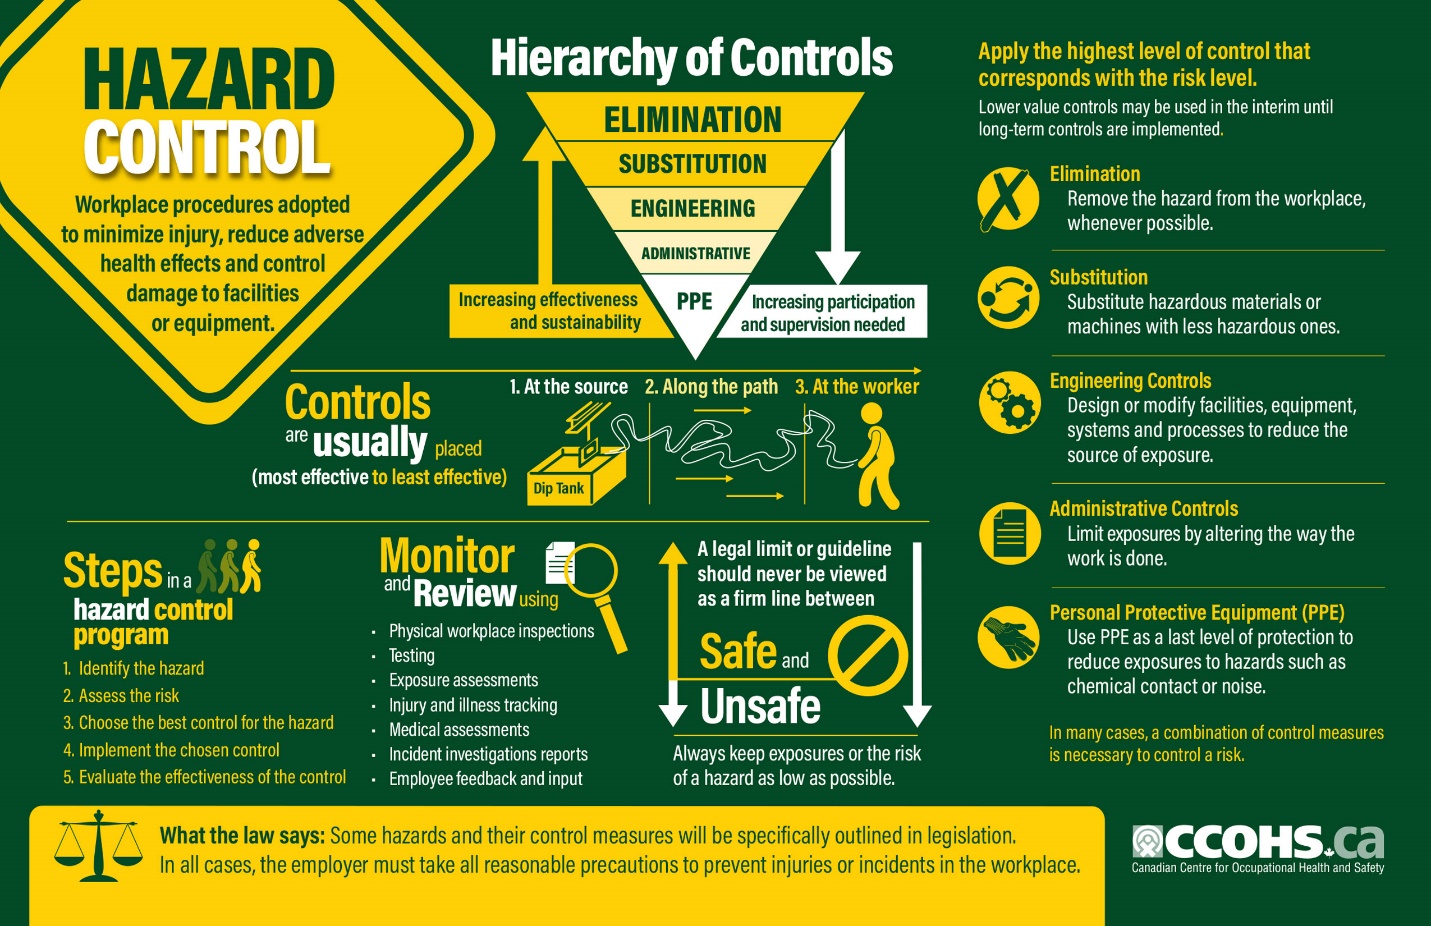
Hierarchy of Controls
Every workplace has hazards, and while many are easy to avoid or have minor impacts, there are many others which can lead to severe injury, damage, and loss.
A hazard control program can protect workers and reduce the occurrence of accidents, illnesses and injuries. It can also help to demonstrate due diligence, improve employee morale, and reduce overall operational costs.
This infographic illustrates the elements of a hazard control program, the hierarchy of controls, and the importance of monitoring and reviewing control systems to protect and keep workers safe. In order to decide the best way to report a hazard, you will need to do a risk assessment to discover if the hazard can be addressed by your team, whether you’ll need to involve your manager/boss, or whether it will require reporting to external bodies or regulators.
For example, if the hazard is a rope that is presenting a tripping hazard, it would be inappropriate to fill out a hazard report, when you could easily just relocate the rope. However, if there is a health and safety hazard such as an oil spill or live wire, you will require a formal report.
Examples
Conducting a Job Hazard Analysis (JHA)
Instructions:
- Reading:
- Go through the provided information to understand the concepts of hazard assessment, risk, and methods to identify hazards.
- Quick Reflection:
- Identify one potential hazard in your surroundings (home, school, or any other familiar place).
- Mini Job Hazard Analysis:
- Use the steps outlined for performing a JHA to analyze the hazard you’ve identified:a. List Tasks: Enumerate tasks or activities related to the identified hazard.b. Break Down Tasks: Choose one task and describe it in a few basic steps.c. Identify Hazards: For each step, pinpoint potential risks.
d. Determine Controls: Suggest one way to reduce each identified risk.
- Use the steps outlined for performing a JHA to analyze the hazard you’ve identified:a. List Tasks: Enumerate tasks or activities related to the identified hazard.b. Break Down Tasks: Choose one task and describe it in a few basic steps.c. Identify Hazards: For each step, pinpoint potential risks.
- Case Study – Hazard Report Form:
- Based on the hazard you’ve identified, complete the “HAZARD/CONCERN REPORT” form’s Part 1, as if you are someone reporting the hazard.
-
HAZARD/CONCERN REPORT
Location:
PART 1 TO BE FILLED OUT BY THE WORKER
Reported to:
Date Reported:
Description of hazard/concern:
Describe in detail and be specific (e.g., ice on front sidewalks, security procedures not followed after school hours, broken ladder in classroom 292). Use an additional sheet of paper if required.
Corrective action taken:
Describe what has been done already to eliminate this hazard or reduce the associated risk, by whom and date.
Residual risk rating:
See next page for matrix
Solutions/corrective actions recommended:
Describe in detail your ideas on how to eliminate this hazard or reduce associated risk. Use an additional sheet of paper if required.
Part 1 Completed by:
Name, Title and Phone Number (Please Print)
Date
Signature
- Brief Reflection on Controls:
- Consider the controls you’ve proposed. Where might they fit in the hierarchy of controls (elimination, engineering, administrative, personal protective equipment)?
- Conclusion:
- In a few sentences, express the value of hazard assessment and reporting in ensuring safety.
Journal Question – Class Discussion
Reflect on your response for the prompt below in relation to effective communication. Share your insights on effectively reporting in the workplace. Share your reflections with the class and engage in a class discussion.
Prompt: Why is it important to have clear reporting policies for hazards, injuries, and environmental impacts in the workplace?
Criteria |
Exemplary (4)
|
Accomplished (3)
|
Developing (2)
|
Beginning (1)
|
Purpose |
Strong voice and tone that clearly addresses the purpose for writing. | Appropriate voice and tone. The purpose is largely clear. | Attempts to use personal voice and tone. Somewhat addresses the intended purpose. | Demonstrates limited awareness of use of voice and tone. Limited evidence of intended purpose. |
Understanding |
Many interesting, specific facts and ideas are included. | Many facts and ideas are included. | Some facts and ideas are included. | Few facts and ideas are included. |
Conventions |
All grammar and spelling is correct. | Only one or two grammar and spelling errors. | A few grammar and spelling errors. | Many grammar and spelling errors. |
Reply |
Made two significant contributions to the class discussion. Highly supportive of others. | Made one contribution to the class discussion. Supported group members. | Attempted to contribute to the class discussion but was vague and unclear in the contribution. | Minimally involved. Offered limited support to classmates. |
Works Cited:
Foundational pillars. Foundational Pillars. (n.d.). https://pillars.worksafesask.ca/
Lesson 3: Hazards, Injuries and Environmental Impacts (Week 2)
Learning Objectives
- Explain devices for reporting hazards, injuries, and environmental impacts
- Identify hazards and apply risk assessment techniques
Risk Assessments
What is a risk assessment?
Risk assessment is a term used to describe the overall process or method where you:
- Identify hazards and risk factors that have the potential to cause harm (hazard identification).
- Analyze and evaluate the risk associated with that hazard (risk analysis, and risk evaluation).
- Determine appropriate ways to eliminate the hazard or control the risk when the hazard cannot be eliminated (risk control).
A risk assessment is a thorough look at your workplace to identify those things, situations, processes, etc. that may cause harm, particularly to people. After identification is made, you analyze and evaluate how likely and severe the risk is. When this determination is made, you can next, decide what measures should be in place to effectively eliminate or control the harm from happening.
The CSA Standard Z1002 “Occupational health and safety – Hazard identification and elimination and risk assessment and control” uses the following terms:
The CSA Standard Z1002 “Occupational health and safety – Hazard identification and elimination and risk assessment and control” uses the following terms:
- Risk assessment – the overall process of hazard identification, risk analysis, and risk evaluation.
- Hazard identification – the process of finding, listing, and characterizing hazards.
- Risk analysis – a process for comprehending the nature of hazards and determining the level of risk.
- Notes:
- Risk analysis provides a basis for risk evaluation and decisions about risk control.
- Information can include current and historical data, theoretical analysis, informed opinions, and the concerns of stakeholders.
- Risk analysis includes risk estimation.
- Notes:
- Risk evaluation – the process of comparing an estimated risk against given risk criteria to determine the significance of the risk.
- Risk control – actions implementing risk evaluation decisions.
- Note: Risk control can involve monitoring, re-evaluation, and compliance with decisions.
Review the following document for definitions and more information about what hazards and risks are, according to the CCOHS: Hazard and Risk
Stop and Reflect
Think to yourself and/or discuss the concepts below with family and friends:
- Reflect on the process of risk assessment as described. How do the different stages (from hazard identification to risk control) interconnect and ensure a comprehensive approach to safety in the workplace? Consider the importance of each step and how omitting one could impact the overall safety and well-being of workers. How might the information from risk analysis, which includes historical data and stakeholders’ concerns, influence the decisions made in risk evaluation and control?
Why is risk assessment important?
Risk assessments are very important as they form an integral part of an occupational health and safety management plan. They help to:
- Create awareness of hazards and risk.
- Identify who may be at risk (e.g., employees, cleaners, visitors, contractors, the public.
- Determine whether a control program is required for a particular hazard.
- Determine if existing control measures are adequate or if more should be done.
- Prevent injuries or illnesses, especially when done at the design or planning stage.
- Prioritize hazards and control measures.
- Meet legal requirements where applicable.
What is the goal of risk assessment?
The aim of the risk assessment process is to evaluate hazards, then remove that hazard or minimize the level of its risk by adding control measures, as necessary. By doing so, you have created a safer and healthier workplace.
- The goal is to try to answer the following questions:
- What can happen and under what circumstances?
- What are the possible consequences?
- How likely are the possible consequences to occur?
- Is the risk controlled effectively, or is further action required?
When should a risk assessment be done?
There may be many reasons a risk assessment is needed, including:
- Before new processes or activities are introduced.
- Before changes are introduced to existing processes or activities, including when products, machinery, tools, equipment change or new information concerning harm becomes available.
- When hazards are identified.
How do you plan for a risk assessment?
In general, determine:
- What the scope of your risk assessment will be (e.g., be specific about what you are assessing such as the lifetime of the product, the physical area where the work activity takes place, or the types of hazards).
- The resources needed (e.g., train a team of individuals to carry out the assessment, the types of information sources, etc.).
- What type of risk analysis measures will be used (e.g., how exact the scale or parameters need to be in order to provide the most relevant evaluation).
- Who are the stakeholders involved (e.g., manager, supervisors, workers, worker representatives, suppliers, etc.).
- What relevant laws, regulations, codes, or standards may apply in your jurisdiction, as well as organizational policies and procedures?
How is a risk assessment done?
Assessments should be done by a competent person or team of individuals who have a good working knowledge of the situation being studied. Include either on the team or as sources of information, the supervisors and workers who work with the process under review as these individuals are the most familiar with the operation.
In general, to do an assessment, you should:
- Identify hazards.
- Determine the likelihood of harm, such as an injury or illness occurring, and its severity.
- Consider normal operational situations as well as non-standard events such as maintenance, shutdowns, power outages, emergencies, extreme weather, etc.
- Review all available health and safety information about the hazard such as Safety Data Sheet (SDS), manufacturers literature, information from reputable organizations, results of testing, workplace inspection reports, records of workplace incidents (accidents), including information about the type and frequency of the occurrence, illnesses, injuries, near misses, etc.
- Understand the minimum legislated requirements for your jurisdiction.
- Identify actions necessary to eliminate the hazard, or control the risk using the hierarchy of risk control methods.
- Evaluate to confirm if the hazard has been eliminated or if the risk is appropriately controlled.
- Monitor to make sure the control continues to be effective.
- Keep any documents or records that may be necessary. Documentation may include detailing the process used to assess the risk, outlining any evaluations, or detailing how conclusions were made.
When doing an assessment, also take into account:
- The methods and procedures used in the processing, use, handling or storage of the substance, etc.
- The actual and the potential exposure of workers (e.g., how many workers may be exposed, what that exposure is/will be, and how often they will be exposed).
- The measures and procedures necessary to control such exposure by means of engineering controls, work practices, and hygiene practices and facilities.
- The duration and frequency of the task (how long and how often a task is done).
- The location where the task is done.
- The machinery, tools, materials, etc. that are used in the operation and how they are used (e.g., the physical state of a chemical, or lifting heavy loads for a distance).
- Any possible interactions with other activities in the area and if the task could affect others (e.g., cleaners, visitors, etc.).
- The lifecycle of the product, process or service (e.g., design, construction, uses, decommissioning).
- The education and training the workers have received.
- How a person would react in a particular situation (e.g., what would be the most common reaction by a person if the machine failed or malfunctioned).
It is important to remember that the assessment must take into account not only the current state of the workplace but any potential situations as well.
By determining the level of risk associated with the hazard, the employer, and the health and safety committee (where appropriate), can decide whether a control program is required and to what level.
How are the hazards identified?
Overall, the goal is to find and record possible hazards that may be present in your workplace. It may help to work as a team and include both people familiar with the work area, as well as people who are not – this way you have both the experienced and fresh eye to conduct the inspection. In either case, the person or team should be competent to carry out the assessment and have good knowledge about the hazard being assessed, any situations that might likely occur, and protective measures appropriate to that hazard or risk.
To be sure that all hazards are found:
- Look at all aspects of the work.
- Include non-routine activities such as maintenance, repair, or cleaning.
- Look at accident / incident / near-miss records.
- Include people who work off site either at home, on other job sites, drivers, teleworkers, with clients, etc.
- Look at the way the work is organized or done (include experience of people doing the work, systems being used, etc).
- Look at foreseeable unusual conditions (for example: possible impact on hazard control procedures that may be unavailable in an emergency situation, power outage, etc.).
- Determine whether a product, machine or equipment can be intentionally or unintentionally changed (e.g., a safety guard that could be removed).
- Review all of the phases of the lifecycle.
- Examine risks to visitors or the public.
- Consider the groups of people that may have a different level of risk such as young or inexperienced workers, persons with disabilities, or new or expectant mothers.
It may help to create a chart or table such as the following:
|
Example of Risk Assessment |
||||
|
Task |
Hazard |
Risk |
Priority |
Control |
|
Delivering product to customers |
Drivers work alone |
May be unable to call for help if needed |
|
|
|
Drivers have to occasionally work long hours |
Fatigue, short rest time between shifts |
|
|
|
|
Drivers are often in very congested traffic |
Increased chance of collision |
|
|
|
|
Longer working hours |
|
|
||
|
Drivers have to lift boxes when delivering product |
Injury to back from lifting, reaching, carrying, etc. |
|
|
|
How do you know if the hazard will cause harm (poses a risk)?
Each hazard should be studied to determine its level of risk. To research the hazard, you can look at:
- Product information/manufacturer documentation.
- Past experience (knowledge from workers, etc.).
- Legislated requirements and/or applicable standards.
- Industry codes of practice / best practices.
- Health and safety material about the hazard such as safety data sheets (SDSs), research studies, or other manufacturer information.
- Information from reputable organizations.
- Results of testing (atmospheric or air sampling of the workplace, biological swabs, etc.).
- The expertise of an occupational health and safety professional.
- Information about previous injuries, illnesses, near misses, incident reports, etc.
- Observation of the process or task.
Remember to include factors that contribute to the level of risk such as:
- The work environment (layout, condition, etc.).
- The systems of work being used.
- The range of foreseeable conditions.
- The way the source may cause harm (e.g., inhalation, ingestion, etc.).
- How often and how much a person will be exposed.
- The interaction, capability, skill, and experience of workers who do the work.
Stop and Reflect
Think to yourself and/or discuss the concepts below with family and friends:
- Reflect on a time when you had to evaluate a potential danger at work or in daily life. How did you gather information to understand the situation better? Did personal experiences or advice from others influence your decision? Why do you think it’s essential to consider both the actual situation and the people involved when assessing risk?
How are risks ranked or prioritized?
Ranking or prioritizing hazards is one way to help determine which risk is the most serious and thus which to control first. Priority is usually established by taking into account employee exposure and the potential for incident, injury or illness. By assigning a priority to the risks, you are creating a ranking or an action list.
There is no one simple or single way to determine the level of risk. Nor will a single technique apply in all situations. The organization has to determine which technique will work best for each situation. Ranking hazards requires knowledge of workplace activities, urgency of situations, and most importantly, objective judgement.
For simple or less complex situations, an assessment can literally be a discussion or brainstorming session based on knowledge and experience. In some cases, checklists or a probability matrix can be helpful. For more complex situations, a team of knowledgeable personnel who are familiar with the work is usually necessary.
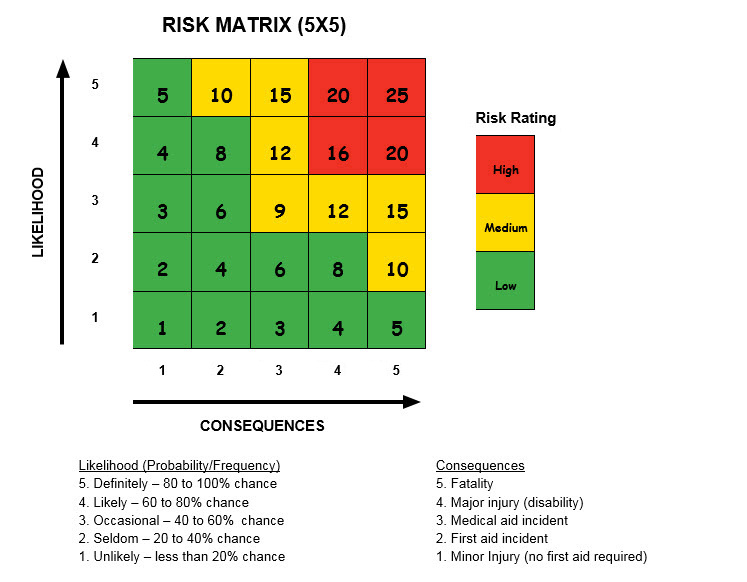
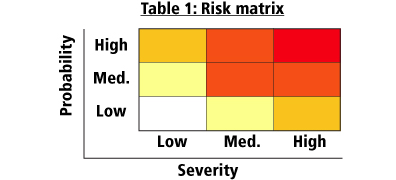
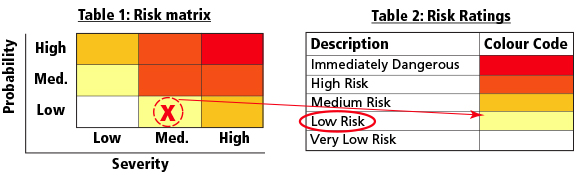
As an example, consider this simple risk matrix. Table 1 shows the relationship between probability and severity.
Severity ratings in this example represent:
- High: major fracture, poisoning, significant loss of blood, serious head injury, or fatal disease
- Medium: sprain, strain, localized burn, dermatitis, asthma, injury requiring days off work
- Low: an injury that requires first aid only; short-term pain, irritation, or dizziness
Probability ratings in this example represent:
 High: likely to be experienced once or twice a year by an individual
- Medium: may be experienced once every five years by an individual
- Low: may occur once during a working lifetime
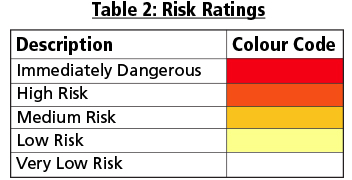
The cells in Table 1 correspond to a risk level, as shown in Table 2.
These risk ratings correspond to recommended actions such as:
- Immediately dangerous: stop the process and implement controls
- High risk: investigate the process and implement controls immediately
- Medium risk: keep the process going; however, a control plan must be developed and should be implemented as soon as possible
- Low risk: keep the process going but monitor regularly. A control plan should also be investigated
- Very low risk: keep monitoring the process
Let’s use an example: When painting a room, a step stool must be used to reach higher areas. The individual will not be standing higher than 1 metre (3 feet) at any time. The assessment team reviewed the situation and agreed that working from a step stool at 1 m is likely to:
- Cause a short-term injury such as a strain or sprain if the individual falls. A severe sprain may require days off work. This outcome is like a medium severity rating.
- Occur once in a working lifetime as painting is an uncommon activity for this organization. This criterion is like a low probability rating.
When compared to the risk matrix chart (Table 1), these values correspond to a low risk.
The workplace decides to implement risk control measures, including the use of a stool with a large top that will allow the individual to maintain stability when standing on the stool. They also determined that while the floor surface is flat, they provided training to the individual on the importance of making sure the stool’s legs always rest on the flat surface. The training also included steps to avoid excess reaching while painting.
What are methods of hazard control?
Once you have established the priorities, the organization can decide on ways to control each specific hazard. Hazard control methods are often grouped into the following categories:
- Elimination (including substitution).
- Engineering controls.
- Administrative controls.
- Personal protective equipment.
Why is it important to review and monitor the assessments?
It is important to know if your risk assessment was complete and accurate. It is also essential to be sure that any changes in the workplace have not introduced new hazards or changed hazards that were once ranked as lower priority to higher priority.
It is good practice to review your assessment on a regular basis to make sure your control methods are effective.
What documentation should be done for a risk assessment?
Keeping records of your assessment and any control actions taken is very important. You may be required to store assessments for a specific number of years. Check for local requirements in your jurisdiction.
The level of documentation or record keeping will depend on:
- Level of risk involved.
- Legislated requirements.
- Requirements of any management systems that may be in place.
Your records should show that you:
- Conducted a good hazard review.
- Determined the risks of those hazards.
- Implemented control measures suitable for the risk.
- Reviewed and monitored all hazards in the workplace.
Learning Task
Instructions:
- Reading:
- Carefully read through the provided information about the importance, goals, planning, and execution of risk assessments.
- Quick Reflection:
- Think of a task you often perform, either at work or at home. What are some potential hazards associated with that task?
- Risk Assessment Simulation:
- For the task you’ve identified:a. Identify Hazards: List potential risks or dangers associated with the task.b. Determine Likelihood: Based on your own judgment, would these risks be high, medium, or low in terms of probability?c. Assess Severity: Again, use your judgment to determine if the outcomes from these risks would be high, medium, or low in severity.
d. Utilize the Risk Matrix: Use the provided risk matrix to categorize and determine the risk level for each hazard.
e. Prioritize Risks: Rank the risks from highest to lowest priority based on your risk matrix outcome.
f. Propose Control Measures: For each identified risk, suggest one or two hazard control methods to mitigate or eliminate the risk. Think about the hierarchy of risk control methods given in the reading.
- For the task you’ve identified:a. Identify Hazards: List potential risks or dangers associated with the task.b. Determine Likelihood: Based on your own judgment, would these risks be high, medium, or low in terms of probability?c. Assess Severity: Again, use your judgment to determine if the outcomes from these risks would be high, medium, or low in severity.
- Case Study:
- Imagine a worker in a factory is responsible for operating a heavy piece of machinery. This machinery has the potential to cause harm if not used correctly. Using the risk matrix, identify potential hazards, determine their likelihood and severity, rank them, and propose hazard controls.
- Hazard Identification Reflection:
- Reflect on the ways hazards are identified. Why is it crucial to consider various sources, such as experience, manufacturer information, and external research?
- Conclusion:
- In a few sentences, summarize the importance of risk assessment in ensuring a safe working environment and the role of the risk matrix and hazard controls in this process.
AART Hazard Reporting System
The AART Hazard Reporting system offers both an app and a web platform for efficient hazard management and is available in Canada. Users can instantly report potential dangers, at-risk behaviours, or close-call events by capturing and annotating photos. Once reported, these observations follow a set workflow, ensuring a documented record of actions taken. The tool facilitates task assignment and monitoring, and users receive notifications about new reports. It supports the allocation of corrective and preventive measures to the safety team for swift intervention. Additionally, the system provides visual data representations through a KPI dashboard to evaluate hazard reports. This ensures all reported hazards are addressed and resolved effectively.
Watch this video to learn more:
Journal Question
Reflect on your response for the prompt below in relation to effective communication. Share your insights on effectively identifying hazards in the workplace and applying risk assessment techniques. Share your reflections with the class and engage in a class discussion.
Prompt: Share an experience where you identified a hazard or environmental impact and applied risk assessment techniques. What actions did you take to mitigate the risks involved?
Criteria |
Exemplary (4)
|
Accomplished (3)
|
Developing (2)
|
Beginning (1)
|
Purpose |
Strong voice and tone that clearly addresses the purpose for writing. | Appropriate voice and tone. The purpose is largely clear. | Attempts to use personal voice and tone. Somewhat addresses the intended purpose. | Demonstrates limited awareness of use of voice and tone. Limited evidence of intended purpose. |
Understanding |
Many interesting, specific facts and ideas are included. | Many facts and ideas are included. | Some facts and ideas are included. | Few facts and ideas are included. |
Conventions |
All grammar and spelling is correct. | Only one or two grammar and spelling errors. | A few grammar and spelling errors. | Many grammar and spelling errors. |
Reply |
Made two significant contributions to the class discussion. Highly supportive of others. | Made one contribution to the class discussion. Supported group members. | Attempted to contribute to the class discussion but was vague and unclear in the contribution. | Minimally involved. Offered limited support to classmates. |
